Hi all.
I've created my own bunch of scripts to: convert comic in PDF -> images, shave margins, scale images and compose a PDF that fits perfectly on my ebook screen.
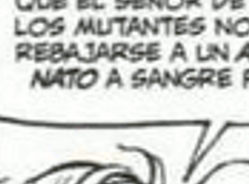
But I've noticed that (due to the scanning process) the black colours in images are "grays" and the white background has "junk". You can see it in this example:
By using The GIMP, I'm able to change the colour curve (Right Click -> Colours -> Curves) to "enhance" the black and "homogenize" the whites:
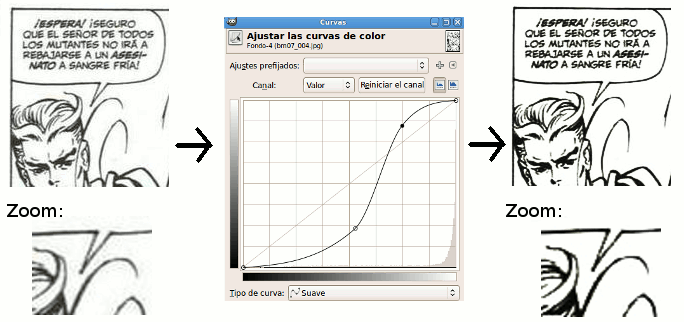
This is a manual process and I would like to add the "improve black + homogenize white" effect to my "convert" command line scripts.
Is it possible to achieve such effect from "command line"?
Thanks.
Adjust colour curve of an image (for ebook output)
- fmw42
- Posts: 25562
- Joined: 2007-07-02T17:14:51-07:00
- Authentication code: 1152
- Location: Sunnyvale, California, USA
Re: Adjust colour curve of an image (for ebook output)
try -sigmoid-contrast see http://www.imagemagick.org/Usage/color_mods/#sigmoidal
or my script below called curves, though it is not interactive.
Re: Adjust colour curve of an image (for ebook output)
Thanks for the link!fmw42 wrote:try -sigmoid-contrast see http://www.imagemagick.org/Usage/color_mods/#sigmoidal
or my script below called curves, though it is not interactive.
This seems to do the work:
Code: Select all
convert in.jpg -contrast-stretch 10% -sigmoidal-contrast 10,50% -normalize out.jpg
Thanks!
- GreenKoopa
- Posts: 457
- Joined: 2010-11-04T17:24:08-07:00
- Authentication code: 8675308
Re: Adjust colour curve of an image (for ebook output)
fmw42 is right that -sigmoidal-contrast is probably your best option. You might try increasing the midpoint value instead of using -contrast-stretch. When I was playing with this, I generated histograms to help understand my results.
The simplest option is a linear adjustment. There are several operators that do this, allowing you to specify what you want in a variety of ways. On the other end, full curves are available. Using linear gives you clipping; using curves gives you a headache. -sigmoidal-contrast avoids both. There is an entire page of examples.
Code: Select all
convert -size 1x4096 gradient:black-white ^
-sigmoidal-contrast 6x60%% ^
-define histogram:unique-colors=false histogram:hist.png
- fmw42
- Posts: 25562
- Joined: 2007-07-02T17:14:51-07:00
- Authentication code: 1152
- Location: Sunnyvale, California, USA
Re: Adjust colour curve of an image (for ebook output)
You can also modify the gradient using any IM function including -sigmoid-contrast and use Anthony's im_profile script (or my profile script) to see the output vs input graph, i.e. to show the curve itself. Anthony's scripts are at http://www.imagemagick.org/Usage/scripts/
-contrast-stretch is linear and works well when you just want to clip some percent on either end of the histogram and thus stretch the contrast. If you don't want to clip, you can use -auto-level and it will find the min and max values in the image and stretch the histogram linearly between those values to full dynamic range.
You can also use non-linear things like -gamma or -evaluate pow (and -sigmoid-contrast).
Also -hald-clut allows you to create a color lookup table and use it over an over for many images. You can also do the same but with less colors with -clut.
My curves script allows you to pick point pairs and does a spline interpolation that goes through each point. Anthony's curves examples requires you to specify the interpolation equation that you want to use and does a best fit, as I recall, but may be wrong on that.