Page 1 of 1
log-scale histogram
Posted: 2018-02-10T14:56:30-07:00
by user001
I am viewing histograms of grayscale images by means of the following command
Code: Select all
magick "$file" -define histogram:unique-colors=false histogram:miff:- | display -
Are there any ImageMagick commands/options to log-scale the counts/frequencies? I would be OK with adding 1 or some other small value to zero-valued bins (or simply ignoring undefined zero-logarithm errors). I realize that I could save the text output, log-scale it myself, and then plot it, but I was hoping there was a simple IM command-line option that would do that for me.
On a somewhat related note, how can "-define histogram:unique-colors=false" be made the default behavior? Only through compile-time changes?
Many thanks.
Re: log-scale histogram
Posted: 2018-02-10T15:41:12-07:00
by fmw42
Do you want the log of the bins or the log of the counts?
If you want the log of the bins, then you can do
Code: Select all
magick "$file" -evaluate log 100 -define histogram:unique-colors=false histogram:miff:- | display -
To take the log of the counts, you would have to write a script to extract the bins and counts from the histogram:info:, then take the log of the counts, then plot them If you Unix-Like platform see my bash unix shell script, plot, at my link below.
What is your exact IM version and platform? Please always provide that.
You cannot set that define as the default, as far as I know, even at compile time.
Re: log-scale histogram
Posted: 2018-02-10T16:00:27-07:00
by user001
I wanted the log of the counts (ordinate). My apologies for omitting my system information: I am using 6.9.7-4 Q16 x86_64 on debian and 7.0.7-1 Q16 x86_64 2017-09-15 on macos, both running bash version 4. I found and tried your plot script on the latter system (which has gnuplot 5.2), but obtained neither output nor error. Perhaps I'm invoking incorrectly (./plot -p histogram infile outfile). Thanks.
Re: log-scale histogram
Posted: 2018-02-10T16:43:51-07:00
by fmw42
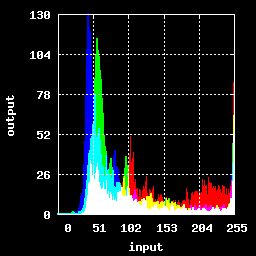
See the histogram example at the bottom.
Input:

Code: Select all
plot -p histogram -m filled -f 1 -w 256 -h 256 -t 20 -d 2 -b 0 -g front rose.png rose_hist.png

See the installation Pointers on my home page at my link below.
I ran the above using ImageMagick 6.9.9.34 Q16 Mac OSX Sierra. I see there is a problem using IM 7 and will look into it.
I will look into using a log plot in GNUPLOT. But I make no guarantees nor timing.
Re: log-scale histogram
Posted: 2018-02-10T17:03:06-07:00
by fmw42
I have fixed the plot script so that it now works again for IM 7.
Re: log-scale histogram
Posted: 2018-02-10T17:23:49-07:00
by user001
Thanks, I tried the command you posted and read the pointers. I still fail to obtain output, but I will try on my linux machine when I get the chance. Temporary files with the names plot_1_17538.mpc and plot_1_17538.cache (or similar) are created in the working directory while the program is running, but both are deleted and no permanent output is produced. `set logscale y` would work in gnuplot. I'm not sure how it handles undefined values (log(0)). Thanks.
PS: The lack of output I am experiencing continues with the updated version.
Re: log-scale histogram
Posted: 2018-02-10T18:22:32-07:00
by fmw42
Try it now. I commented out one line that sometimes causes that symptom.
Do you get any error messages, now. If not. then I am not sure what the issue might be. I would have to send you a copy of the file with debug messages and saved temporary files to test the script to see what might be the issue.
Did you make modifications to the script or your .profile according to the instructions. Did you edit the file to change
# set directory for temporary files
dir="." # suggestions are dir="." or dir="/tmp"
To
# set directory for temporary files
dir="/tmp" # suggestions are dir="." or dir="/tmp"
Does that help?
The command I gave above, needs to have the input and output in the same directory as where you run the script.
If you have not modified your .profile, then preface the command with bash
Code: Select all
bash plot -p histogram -m filled -f 1 -w 256 -h 256 -t 20 -d 2 -b 0 -g front rose: rose_hist.png
and have the script in the same directory as you have your input and output.
Re: log-scale histogram
Posted: 2018-02-10T20:23:25-07:00
by fmw42
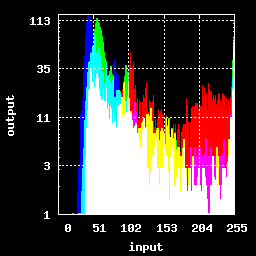
It turns out, I already had a argument -l to make a log plot of the counts in the histogram in the plot script.
Code: Select all
plot -p histogram -l -m filled -f 1 -w 256 -h 256 -t 20 -d 2 -b 0 -g front rose: rose_hist_log.png


